Platos Proactive Health Signals Report: 2025
Discover the key insights from our 2025 data — including why weight alone can be misleading, how users are forming sustained tracking habits, and what body composition reveals about early metabolic change

Early signals from real-world metabolic health tracking
Why proactive health matters
Preventive health begins before diagnosis — when change is still small, often reversible, and shaped primarily by daily behavior.
Two realities make early action difficult:
- Risk accumulates quietly. Many meaningful shifts happen before symptoms, clinical thresholds, and often before a person feels “unwell.”
- Weight alone can be misleading. A single scale number compresses multiple biological processes into one line, masking underlying shifts in fat, muscle, and metabolic markers.
In 2025, Platos saw a meaningful shift: more people moved from one-off measurements to repeated tracking across time. That transition — from isolated readings to visible trends — is where early signals begin to emerge.
Expanding the Measurement Infrastructure
In 2025, Platos significantly expanded access to preventive metabolic measurement across Nigeria.
• 30+ new pharmacy partners were onboarded
• Distribution extended to 300+ pharmacy locations
• More than 10,000 individuals were screened through in-store and community health activations
This expansion increased access to structured body composition and metabolic measurement in everyday settings — not only clinics.
Greater access alone does not create longitudinal insight. But it creates the conditions for it.
As distribution expanded, more individuals moved from one-off screening to repeat measurement, enabling the early formation of longitudinal metabolic visibility described in this report.
Who this data represents
In 2025, the majority of measurement activity occurred in Nigeria, concentrated in major urban centres including Lagos, Abuja, and Ibadan. A smaller share came from international users across multiple countries, including the United States, the United Kingdom, Italy, the Netherlands, Israel, and Ghana.
Most users measured using the Platos Body Monitor. A small minority imported data through Apple Health or Health Connect, primarily heart rate, blood pressure, and weight.
Users often selected multiple goals. While weight management remained the dominant entry point, a substantial minority engaged for broader metabolic visibility — including prevention, disease management, and muscle health.
This reflects a platform anchored in weight-related goals, but increasingly expanding toward broader metabolic visibility.
What We Observed in 2025
1. Measurement momentum accelerated
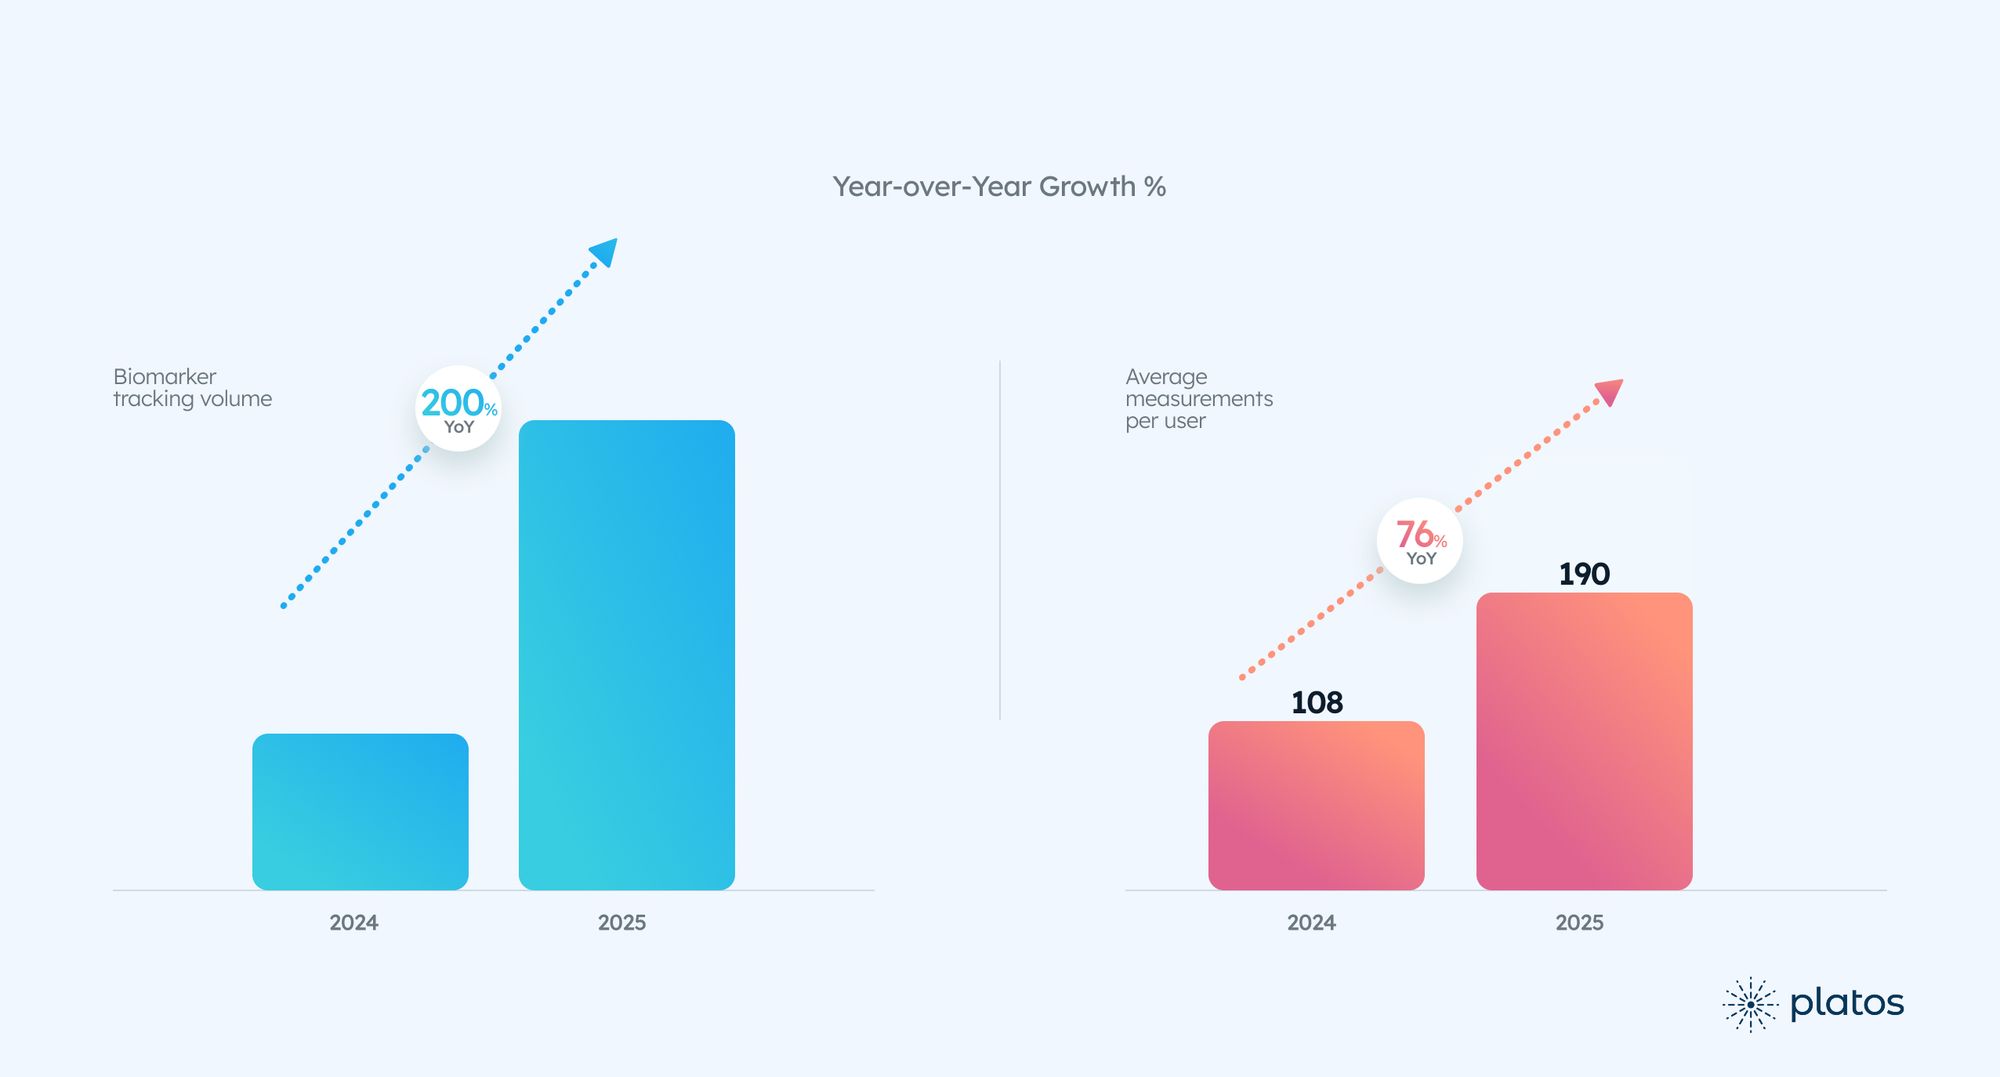
Biomarker tracking volume grew significantly year over year, increasing by more than 200%.
Per-user measurement depth also increased meaningfully. On average, users logged approximately 190 measurements per year, up from roughly 108 the year before — indicating materially deeper repeat engagement over time.
Measurement activity accelerated throughout the year, with the final quarter contributing the highest share of total logging.
This indicates not only user acquisition, but also deepening behavioral activation.
2. Repeat measurement began quickly — Sustained tracking emerged selectively
While all measurers recorded at least one biomarker, a meaningful subset returned to measure again:
- Nearly 40% measured on two or more separate days
- One quarter reached four or more measurement days
- Roughly one in seven users measured on ten or more separate days, indicating early habit formation.
Among those who returned:
- The median time to a second measurement day was just a few days
- The median time to a fourth measurement day was under two weeks
This suggests initial re-engagement happens quickly, but sustained tracking develops more gradually.
3. Early longitudinal tracking cohort formed
A distinct cohort emerged: users who tracked across multiple weeks, enabling visible trend formation rather than isolated readings.
Roughly one in six measurers recorded measurements on at least four separate days spanning eight weeks or more. This cohort represents the early formation of structured metabolic time-series data.
Within this group:
- Typical tracking lasted around six months
- Users measured on approximately fifteen separate days
- The typical gap between measurements was only a few days
This cadence allowed short-term fluctuations to settle into a visible direction — the foundation of meaningful trend visibility.
4 . Weight and body composition do not always move together
Among users who consistently tracked both weight and fat mass over time, several patterns emerged.
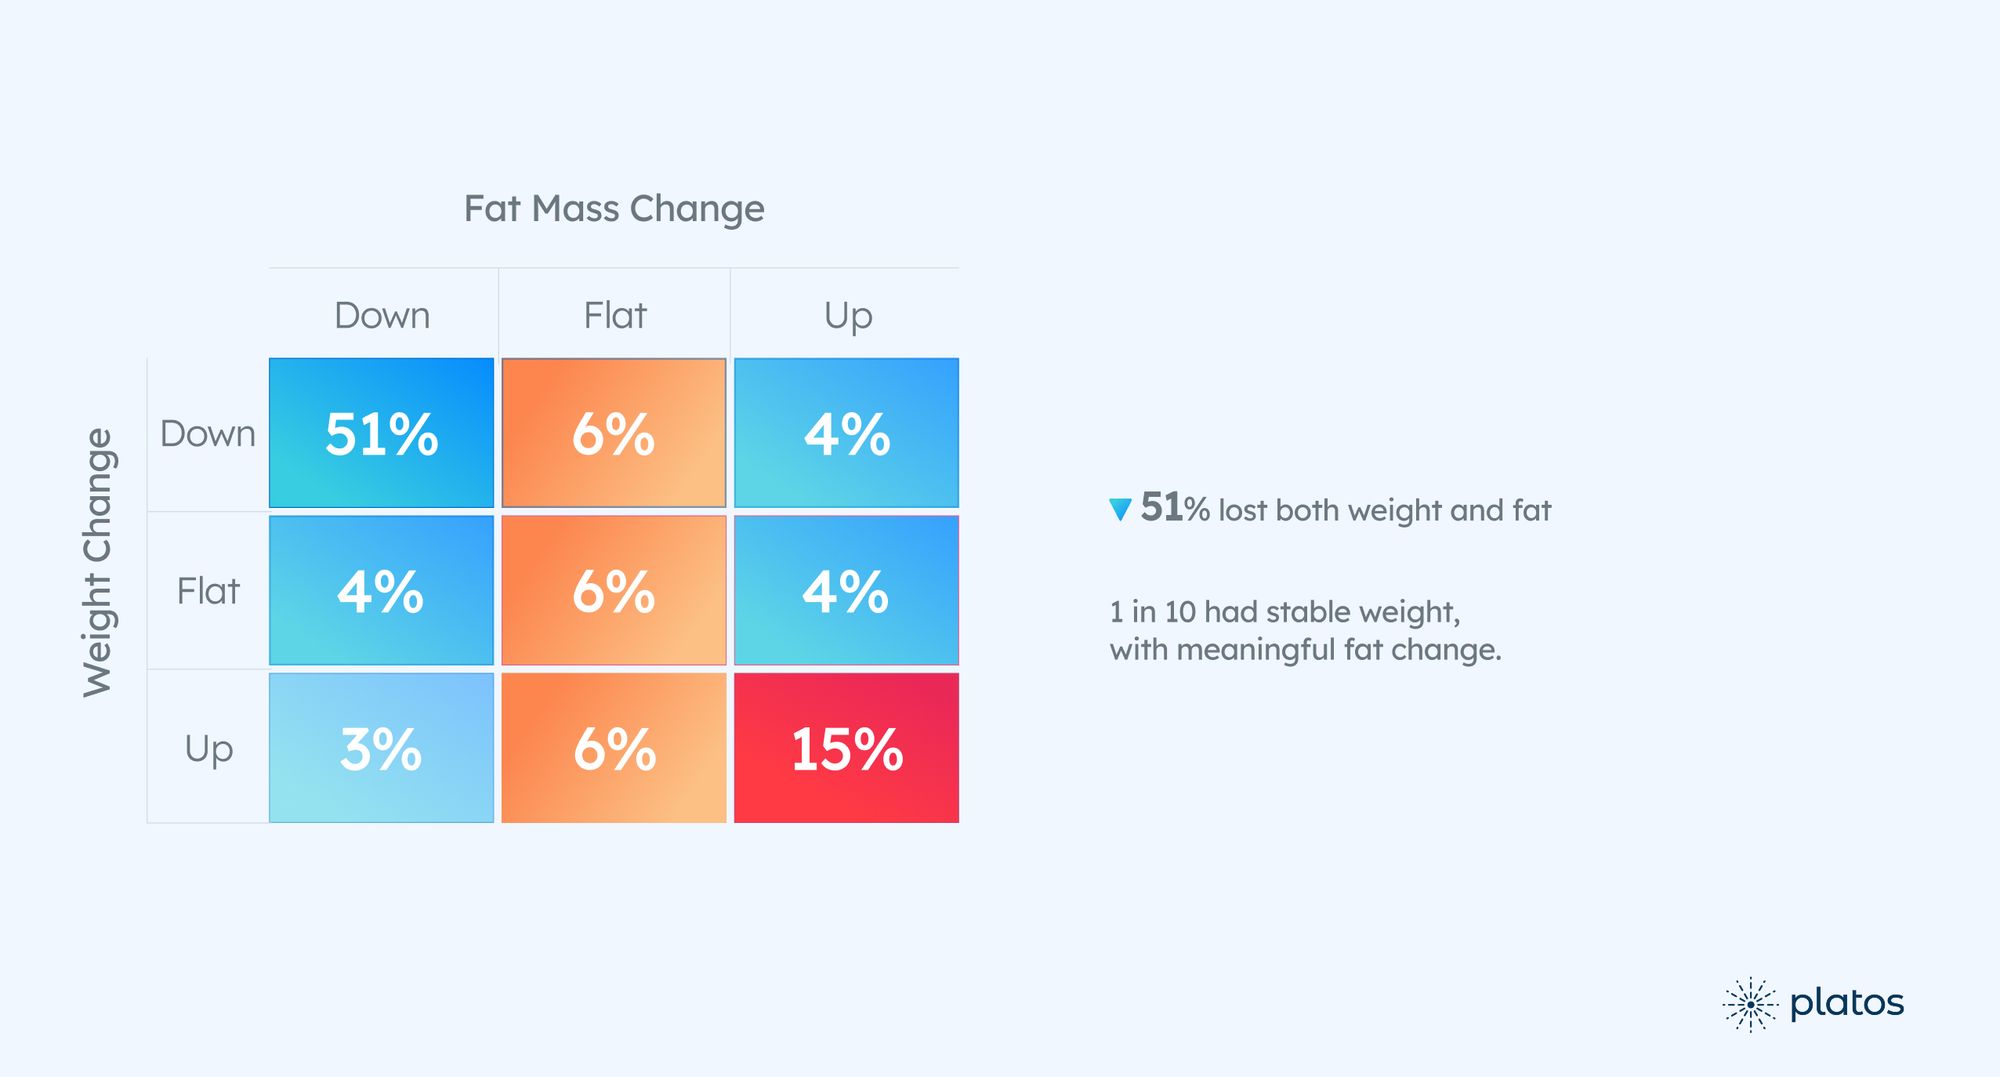
The most common pattern was weight and fat mass moving downward together. However, the data also revealed an important divergence:
Approximately one in ten users showed stable weight, while fat mass changed meaningfully.
In these cases, body composition shifted even though the scale remained largely unchanged.
This reinforces a key insight: Weight alone can mask underlying metabolic changes — both positive and negative.
5. Fat and lean mass follow diverse paths
When fat mass was examined alongside fat-free mass:
- Some users reduced fat while maintaining or increasing lean mass
- Others gained or lost both simultaneously
- Some showed opposing movements between fat and lean tissue
These trajectories highlight that metabolic change is not uniform. Similar scale outcomes can reflect very different underlying biological shifts.
6. Clinical marker tracking remains early — but shows stickiness
A smaller subset of users tracked blood pressure and fasting blood glucose.
While adoption of these markers remains limited relative to body composition tracking, a meaningful share of those who adopted them tracked consistently enough to observe directional trends.
Among users with sufficient longitudinal data:
- Many blood pressure trackers showed downward or stable trends
- Most fasting glucose trackers showed stable or decreasing patterns
These findings are observational and do not imply causation. However, they demonstrate that once users begin tracking clinical markers consistently, directional visibility becomes possible.
What this means for proactive health
Visibility precedes prevention
The most important shift in 2025 was not a single metric. It was the transition from a one-off measurement to repeat measurements.
When users track across weeks and months:
- Variation becomes direction
- Fluctuation becomes a pattern
- Data points become signals
This shift is foundational for proactive health.
Weight is an entry point — not the full story
The data reinforces that:
- Weight loss is not always equivalent to fat loss
- Weight stability does not guarantee metabolic stability
- Identical weight outcomes can reflect very different composition paths
Body composition adds context that scale weight alone cannot provide.
Consistency matters more than intensity
The clearest trends did not emerge from short bursts of frequent measurement. They emerged when users measured consistently across time.
Longitudinal cadence — even at moderate frequency — proved more meaningful than short-term intensity.
What’s next
The next phase is not about collecting more measurements.
It is about turning visibility into clarity.
In 2026, Platos will focus on strengthening the signal layer — helping users:
- Recognize meaningful change earlier
- Understand what is driving that change
- Move from raw metrics to a clearer direction
As longitudinal data deepens, the emphasis will shift from “What changed?” to “What does this mean?”
The ambition is simple:
to make early metabolic change easier to see, easier to interpret, and easier to act on.
Closing perspective
2025 marked a transition:
From isolated measurements to emerging longitudinal visibility.
From raw numbers to observable direction.
These early signals are not clinical outcomes or predictive models.
They represent something more foundational: structured visibility across time.
That foundation — repeated measurement forming visible trends — is the prerequisite for proactive health intelligence.
And it is now beginning to take shape.
Best,
Oladimeji Joseph Fakayode
Founder & CEO, Platos Health
– With contributions from the Platos Data & Outcomes Team